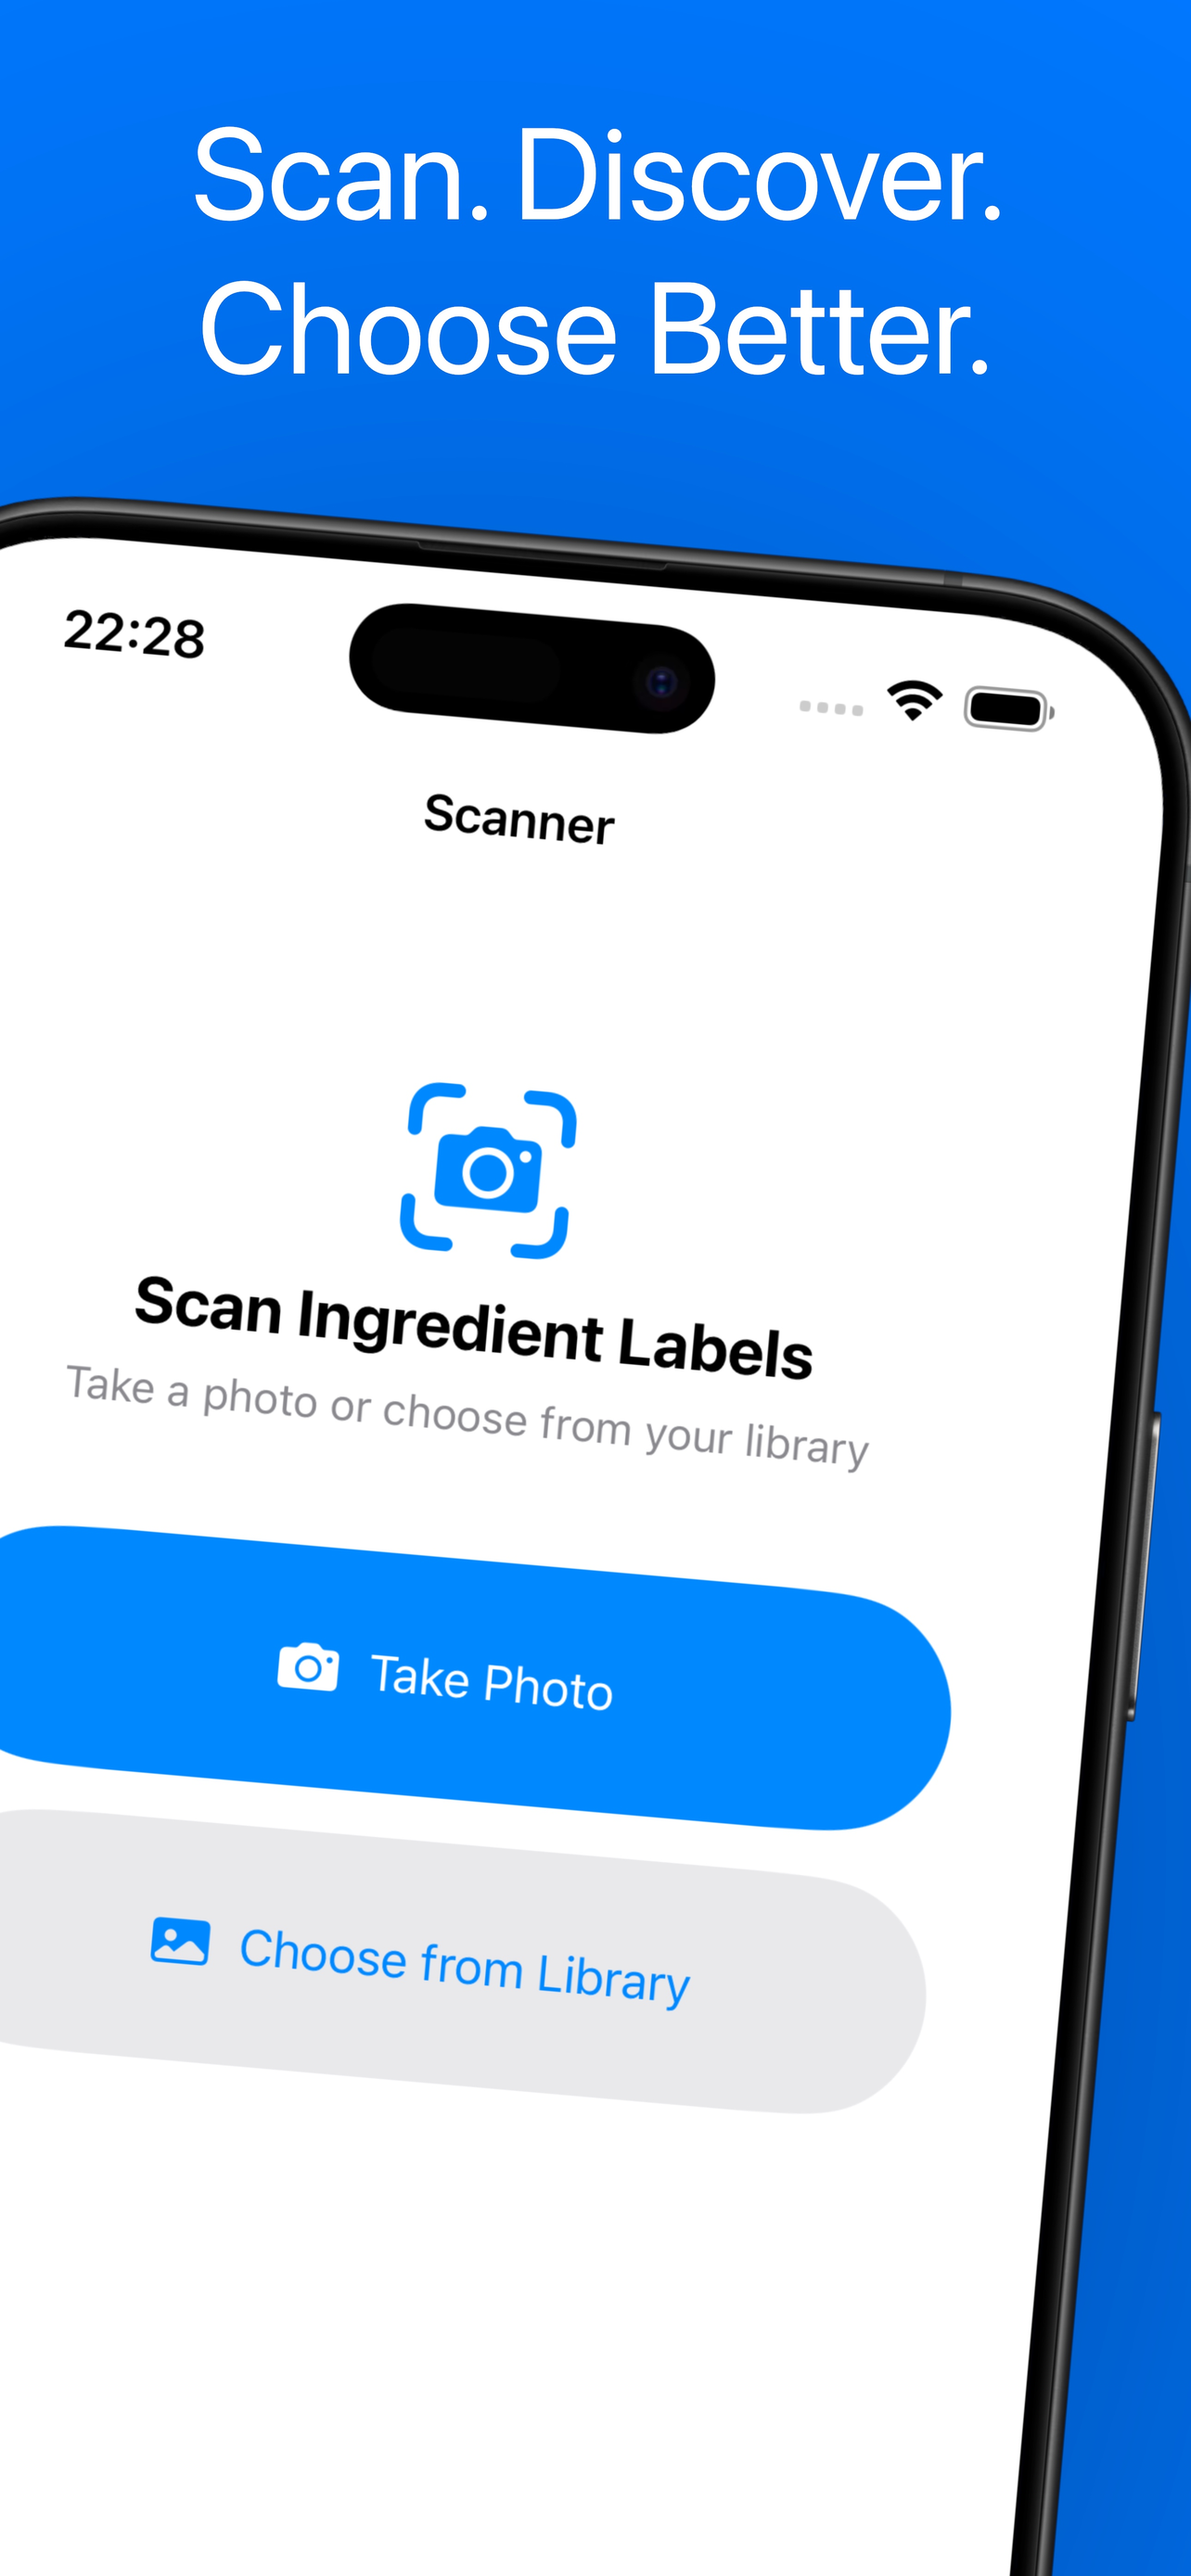
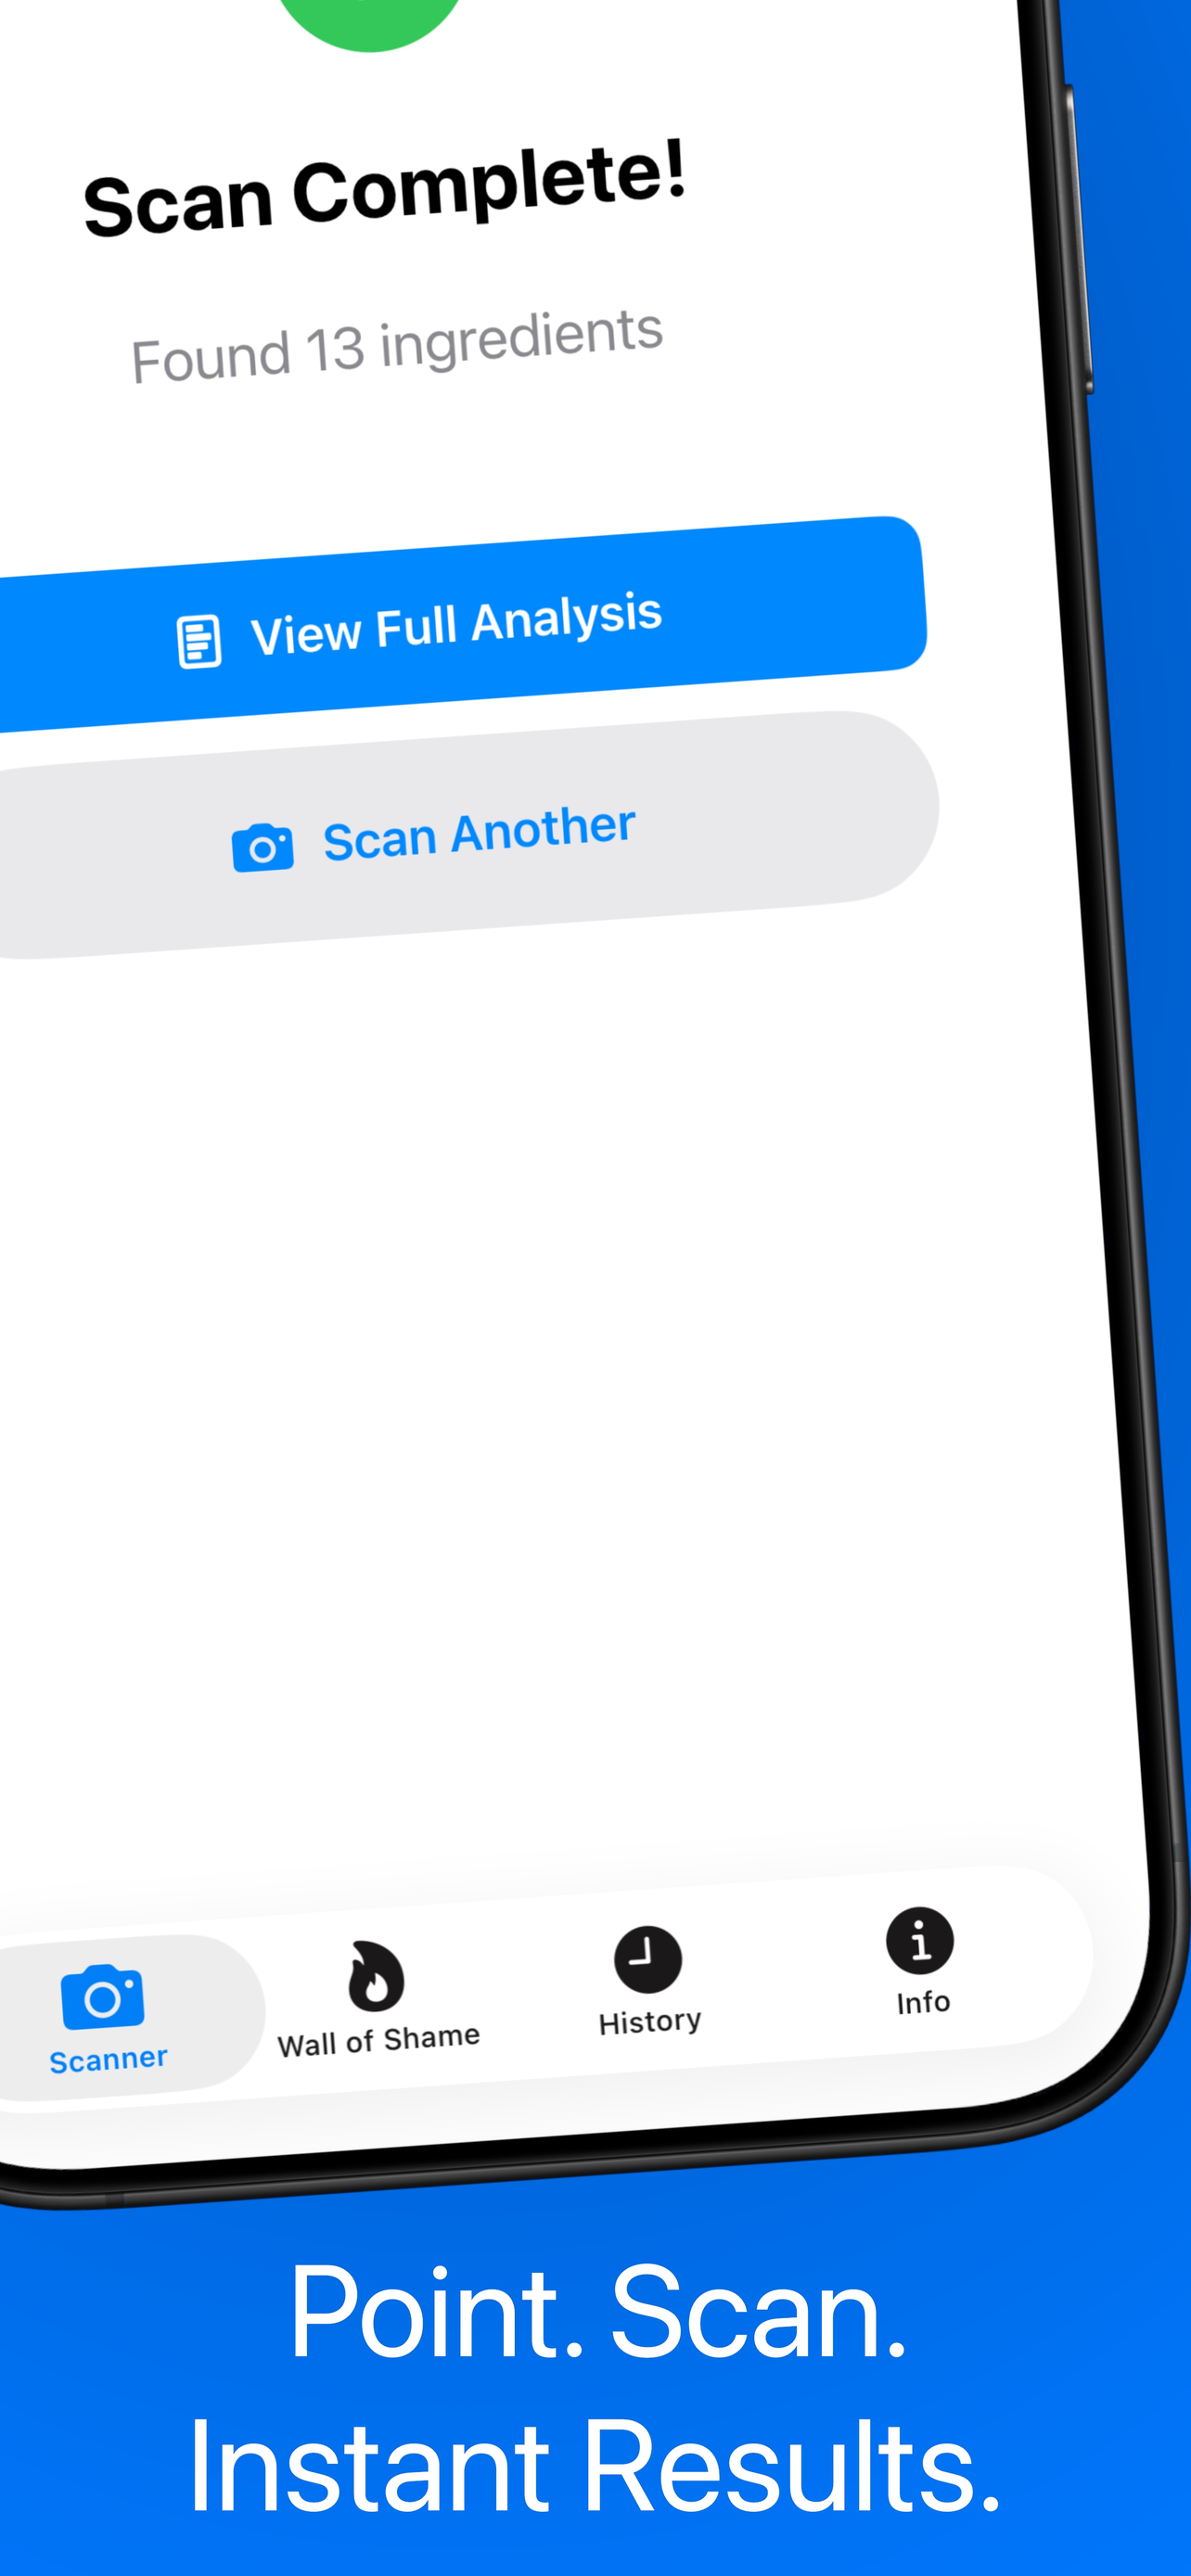
What's actually in the stuff you eat?
Point your camera at an ingredient list. NoJunk reads every line and scores each ingredient 0 to 100. No barcodes. No database lookups. Just the label.
Point your iPhone at the ingredients list on the back of the package. No barcode. No searching. Just the label itself.
NoJunk reads the text, splits it into individual ingredients, and scores each one against published research.
Get an overall 0-100 score, per-ingredient breakdowns, and a plain-English verdict. Put it back or buy it.
NoJunk doesn't look products up in a database — it reads the label you're holding. That means it works on anything with an ingredient list, even weird local brands the barcode apps have never seen.
Apple's Vision framework reads the ingredient paragraph straight off the package. No barcode scan, no database miss. If the label is there, NoJunk can read it.
Every product lands on one of five tiers: Avoid (0-30), Poor (30-50), Mixed (50-65), Decent (65-80), or Clean (80-100). Ingredients listed first weigh more in the final score — because food labels are sorted by weight.
Every ingredient gets its own score, category (preservative, sweetener, colorant, emulsifier, flavor enhancer, natural), and risk level from low to critical. Tap any ingredient to see what it is and why it matters.
Premium scans come with a plain-English summary written for the specific product in front of you — not a generic warning. Informed by FDA, WHO, IARC, EFSA and EWG research.
For flagged ingredients, premium shows you commonly recommended swaps. Instead of just saying "avoid this", it hints at what a cleaner version of the same product usually contains.
The second tab tracks every scan in your history. See your score trend over time, your top offending ingredients, a category breakdown, and how many red-flagged ingredients you've run into. It's a running scoreboard of your shopping habits.
Low gluten, reduce sugar, low fat, high protein, low sodium, dairy free, clean energy, healthy fats, no artificial colors, no preservatives. Pick one, pick ten — it's up to you.
If you flag "reduce sugar", sweeteners get penalized harder on every scan. If you pick "high protein", protein-rich ingredients get a boost. Two people can scan the same product and get different scores — because they care about different things.
Goals are part of onboarding but you can change them anytime. They live on-device, not in a cloud profile, so nothing leaks out.
Every scan comes with a little robot that looks happy, worried, or disgusted depending on the score. Silly, maybe. But it makes reading labels at 6pm in the grocery aisle a lot more fun.
NoJunk uses the NOVA food classification system to understand how processed something really is. Most of what we flag lives in Group 4.
Fresh fruit, vegetables, grains, meat, milk. Foods in their natural state or with small tweaks like freezing, drying, or pasteurization.
Oils, butter, sugar, salt. Things you'd use in a home kitchen, derived from Group 1 foods.
Cheese, canned vegetables, freshly baked bread. Group 1 foods with salt, oil, or sugar added to preserve or flavor them.
Industrial formulations with 5+ ingredients, additives, preservatives, and substances you'd never use at home. These are what NoJunk is really built to catch.
You don't need to memorize any of this. The app reads the label and flags them for you. But here's what we watch for.
What they are: Chemicals that extend shelf life — nitrites, benzoates, sulfites, BHA/BHT and friends.
Why we flag them: A handful are linked to allergic reactions, asthma flare-ups, and long-term concerns. Not all preservatives are bad, which is why we score them individually instead of blanket-flagging.
What they are: Synthetic dyes added to make food look more appealing.
Why we flag them: Several have been tied to hyperactivity in children and allergic reactions in published research.
Examples: Red 40, Yellow 5, Blue 1, Tartrazine (E102).
What they are: Everything from high-fructose corn syrup to aspartame, sucralose, and acesulfame K.
Why we flag them: Added sugar load is one of the biggest drivers of ultra-processed food scores. Artificial sweeteners come with their own question marks.
What they are: MSG, disodium inosinate, disodium guanylate, yeast extract and similar.
Why we flag them: Usually not dangerous on their own, but they're a strong signal that you're deep in Group 4 ultra-processed territory.
What they are: Ingredients that keep oil and water from separating — lecithin, mono- and diglycerides, polysorbates, carrageenan.
Why we flag them: Some have been linked to gut lining issues in preliminary research. We score them case-by-case.
What they are: Partially hydrogenated vegetable oils, still legal in a lot of countries.
Why we flag them: Well-established link to LDL cholesterol and heart disease risk. When NoJunk sees them, it scores hard.
You don't need to learn what every additive does. Snap the label and the app tells you.
E-number guide | Additives worth watching
Both apps care about what's in your food. They go about it differently.
| Feature | NoJunk | Yuka |
|---|---|---|
| How it scans | Camera OCR on the ingredient list | Barcode lookup in a product database |
| Works on unknown products | ✓ Yes — reads any label | Only if the product is in Yuka's DB |
| Per-ingredient scores | ✓ 0-100 per ingredient | Aggregate product score |
| AI verdict | ✓ AI written summary (premium) | Rule-based tags |
| Free tier | 5 scans/day, full basic analysis | Free with premium limits |
| Premium pricing | $2.99/mo, $19.99/yr, $39.99 lifetime | ~$15/yr |
| Personalized scoring | ✓ 10 health goals adjust scores | Fixed scoring |
If you can see the ingredient list, NoJunk can score it. No "product not found" dead ends.
Pay once ($39.99) and you're done. No ongoing subscription if you'd rather not.
Pick your health goals in onboarding and every score bends to what you actually care about.
Five free scans a day. See if it catches things your current app misses.
Full NoJunk vs Yuka comparison
The robot reacts to the score. You'll see.
Free forever for casual use. Premium if you want the deep analysis every time.
Price: $0
What you get: 5 scans a day, full ingredient list, per-ingredient scores, overall 0-100 rating, Wall of Shame dashboard, health goals.
No account. No signup. Install and go.
Price: $2.99 / month
Trial: 7 days free, cancel anytime.
Adds: Unlimited scans, the AI verdict, source references, better-alternative suggestions.
Price: $19.99 / year
Trial: 7 days free. Saves 44% vs monthly.
Adds: Everything premium — unlimited scans, AI verdict, alternatives, sources.
Best value.
Price: $39.99 one time
Trial: None — straight purchase.
Adds: Every premium feature, forever, on this Apple ID. No renewals.
No. NoJunk reads the actual ingredient list on the back of the package. Point your iPhone camera at the ingredients paragraph and the app reads the text, identifies every ingredient, and gives each one a health score. No barcode database means no "product not found" errors — if the label is there, it works.
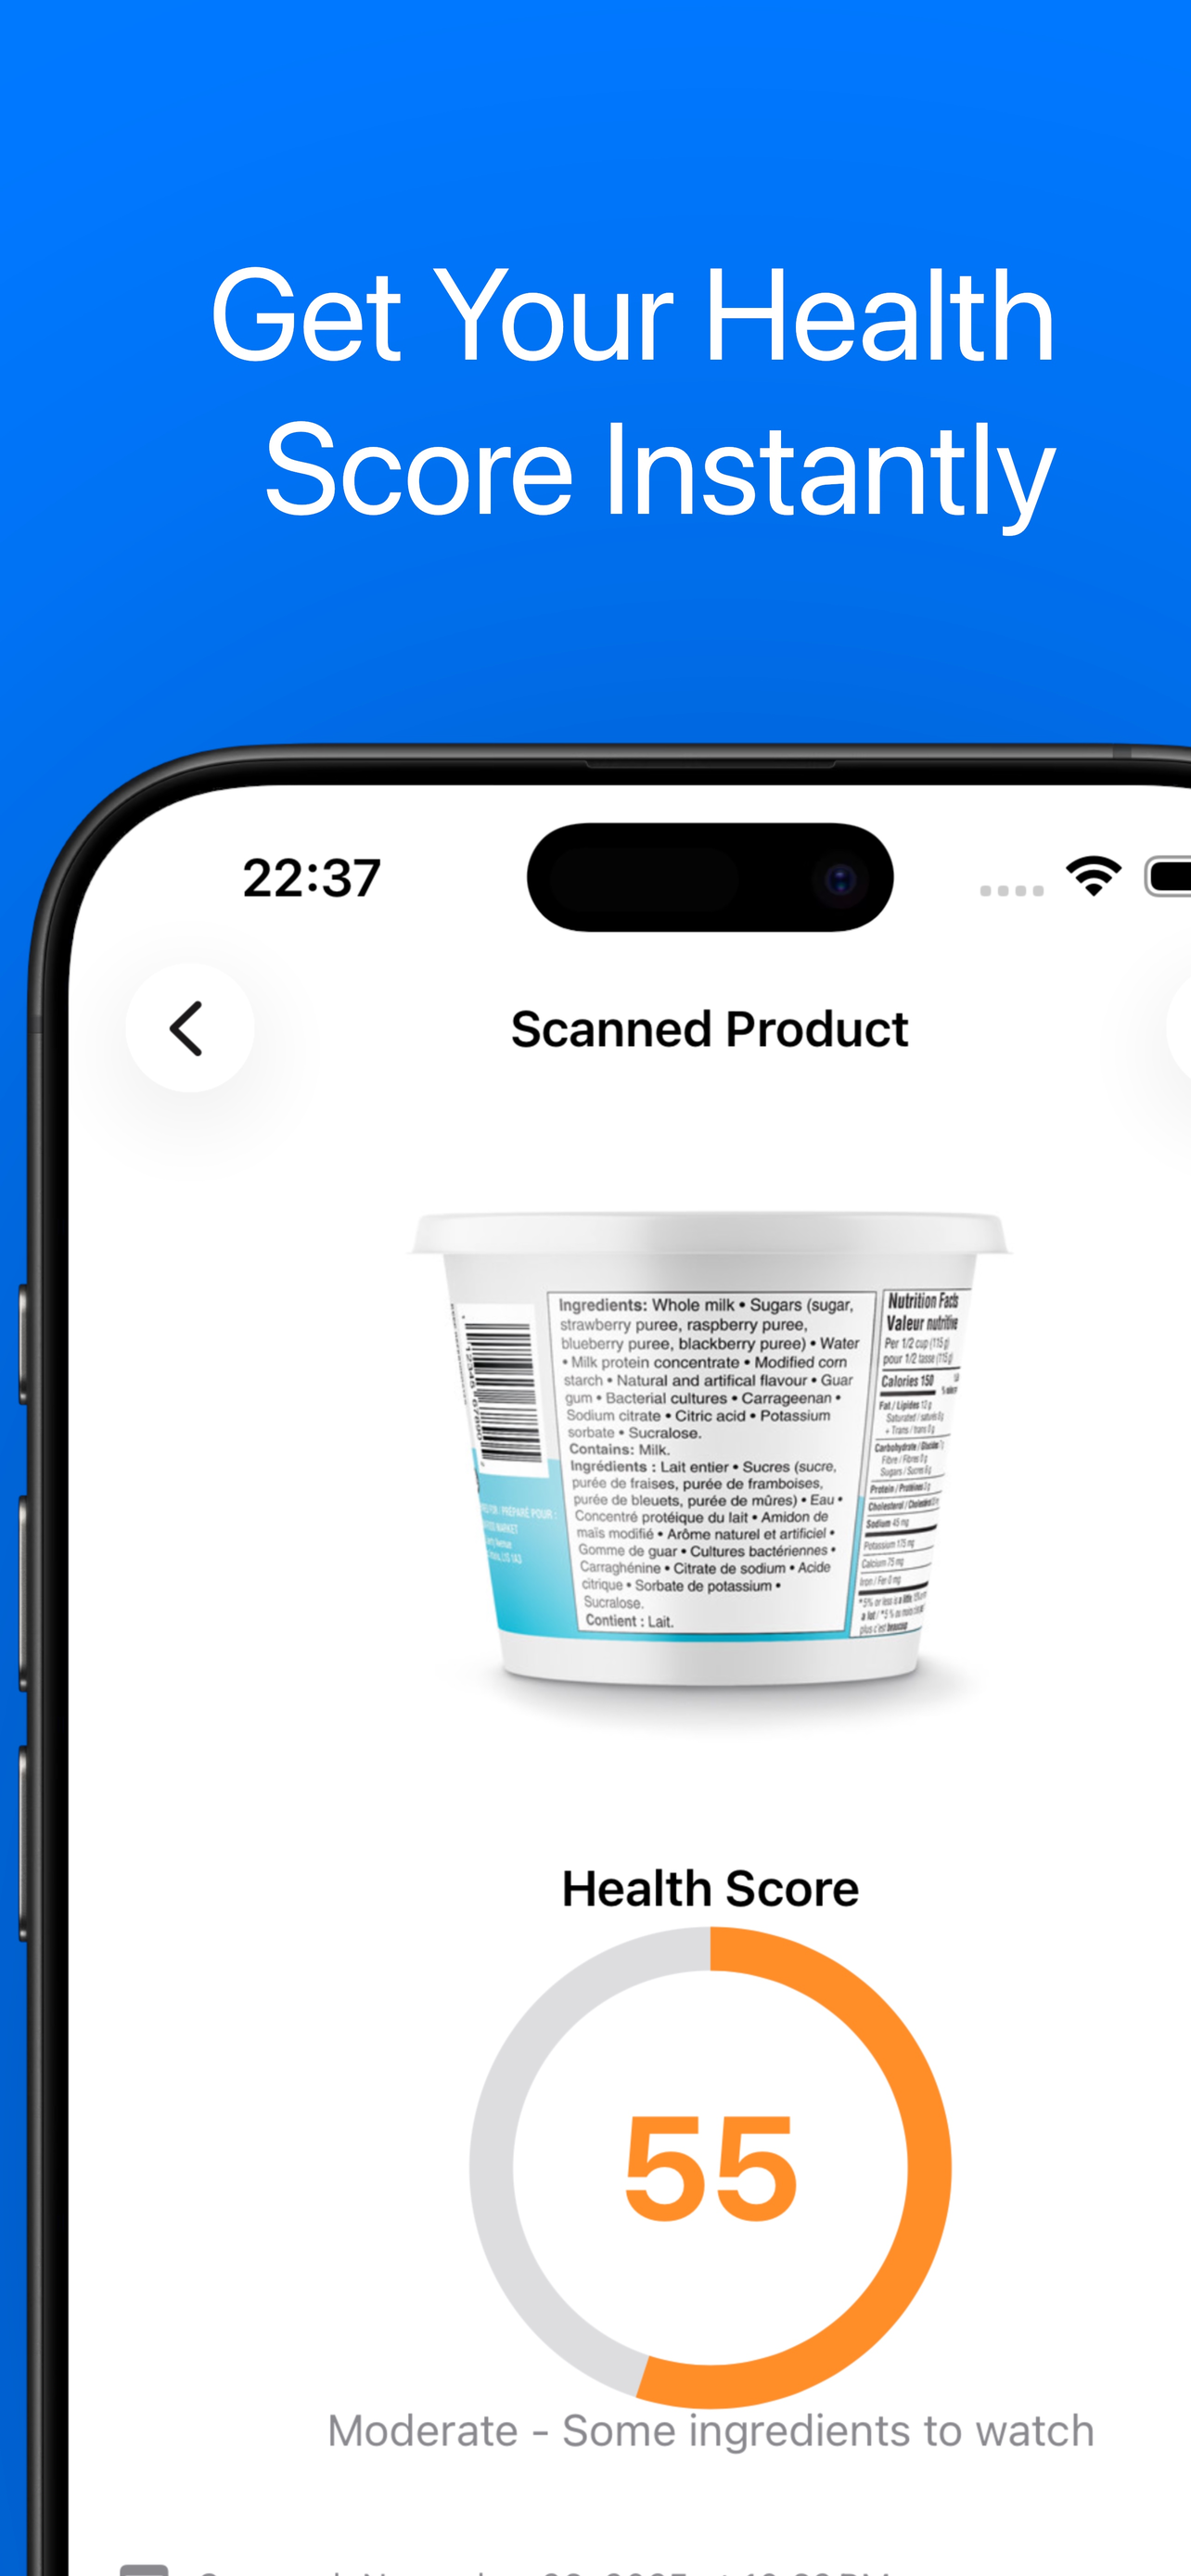
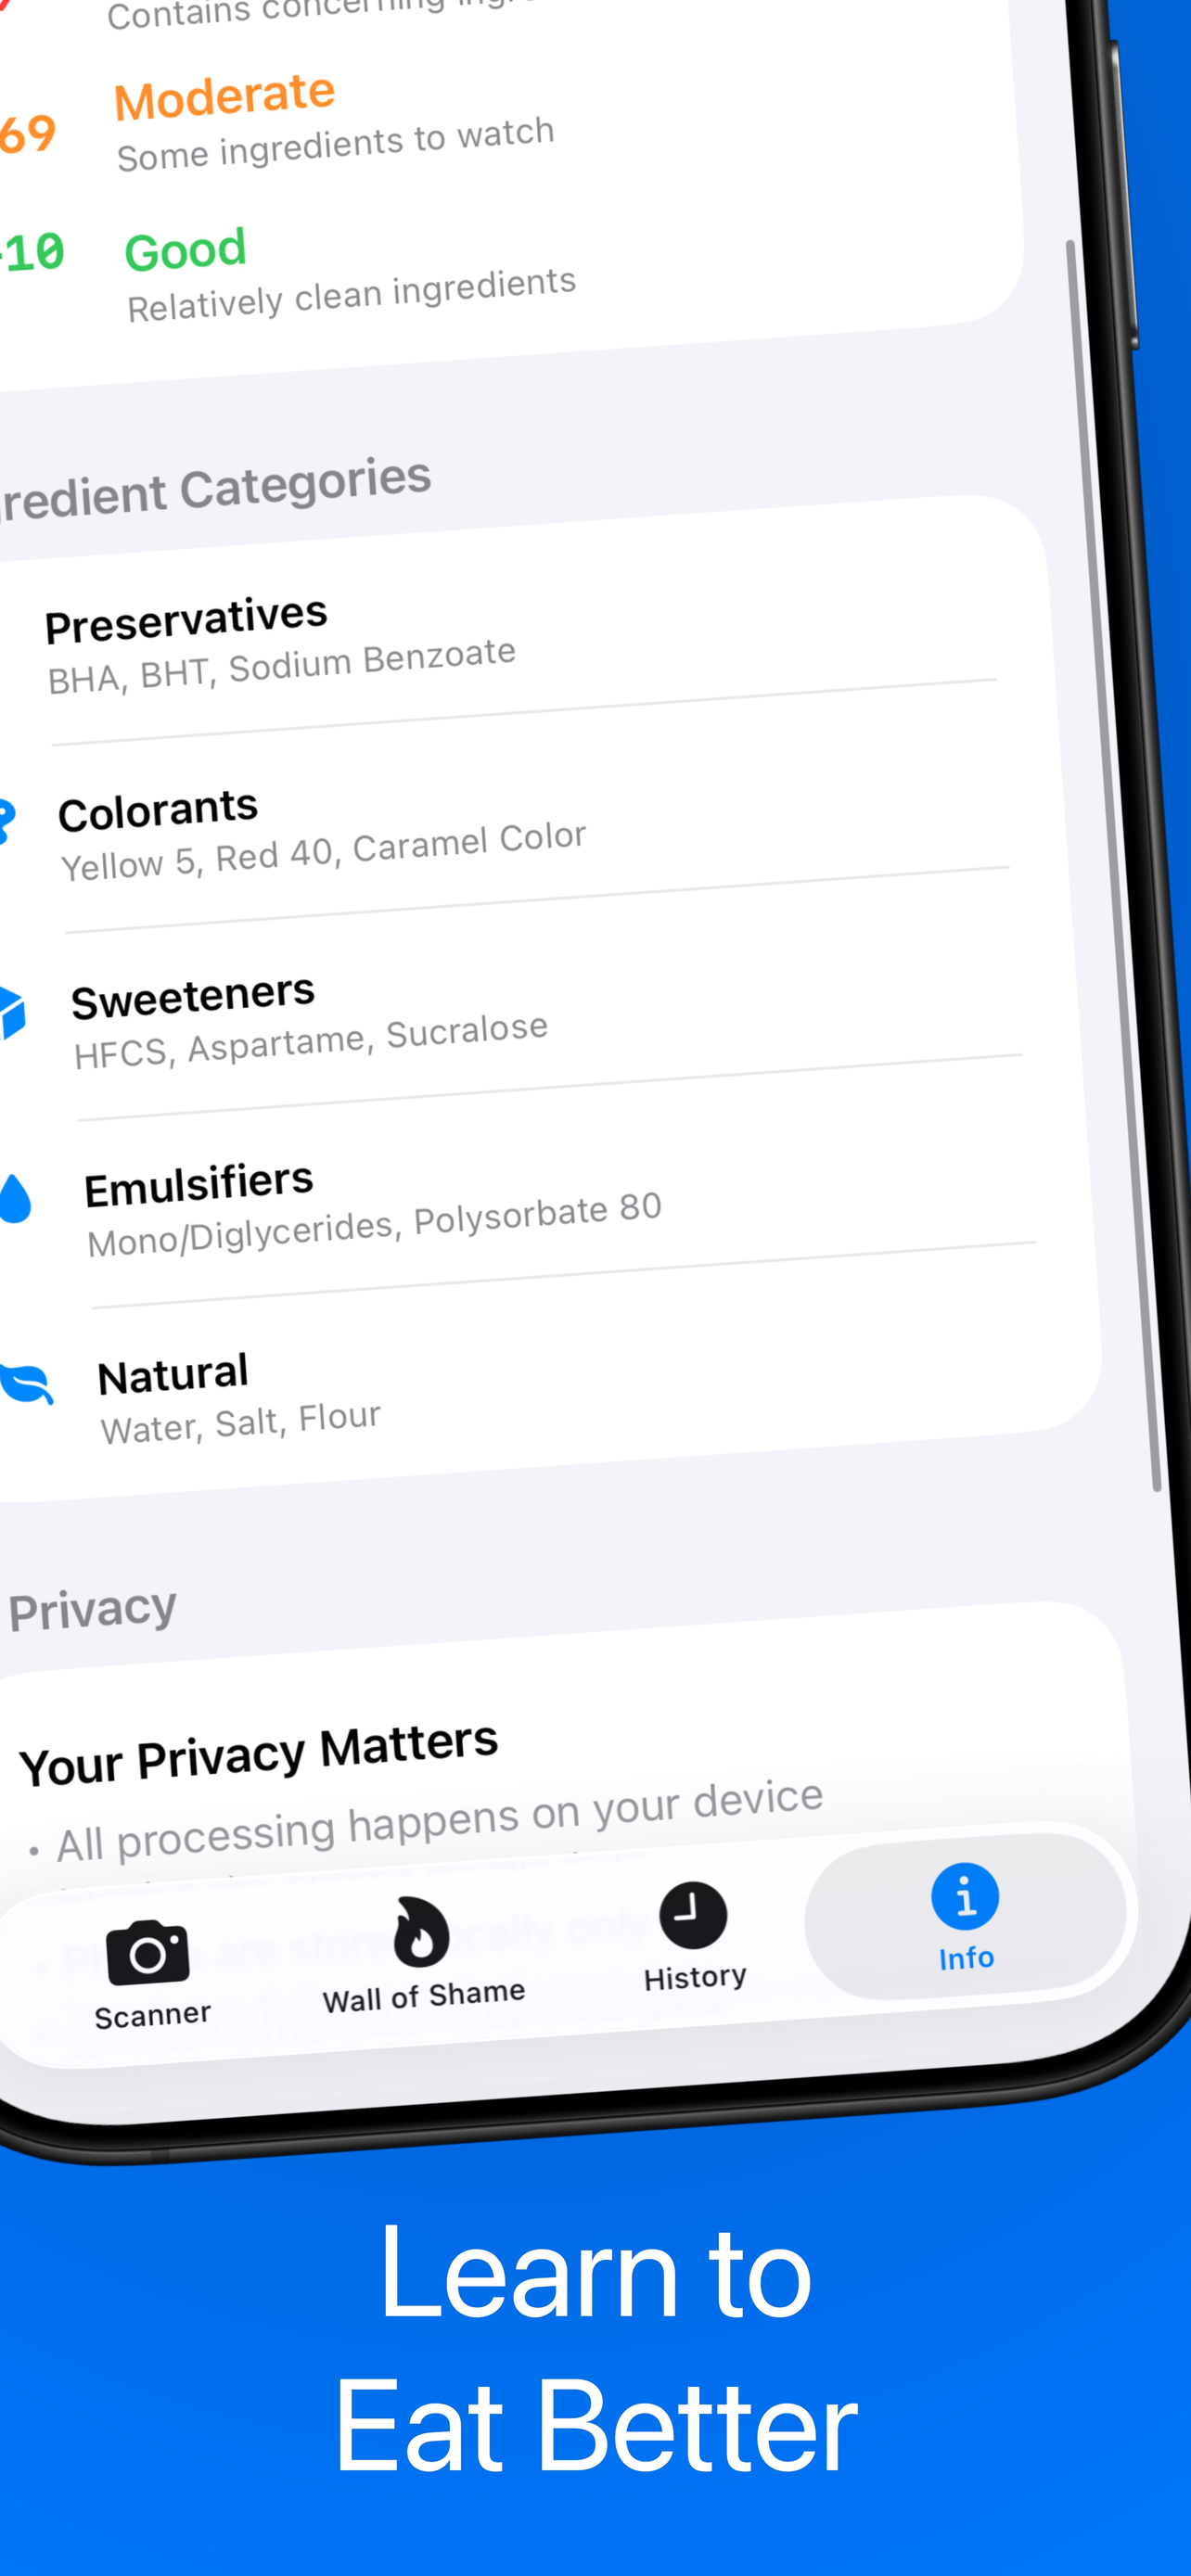
Every ingredient gets a 0-100 score. The overall product score is a position-weighted average: ingredients listed first count more than ingredients near the end, because food labels are legally sorted by weight. The math uses an exponential decay (e^-0.15 * position) so the first five ingredients carry most of the weight. Scores land in one of five tiers: Avoid (0-30), Poor (30-50), Mixed (50-65), Decent (65-80), or Clean (80-100).
Yes. Free users get 5 scans a day including the full ingredient list, per-ingredient scores, the overall rating, scan history, and the Wall of Shame dashboard. Premium ($2.99/mo, $19.99/yr, or $39.99 lifetime) adds unlimited scans, the AI verdict card, source references, and better-alternative suggestions. Both monthly and yearly come with a 7-day free trial.
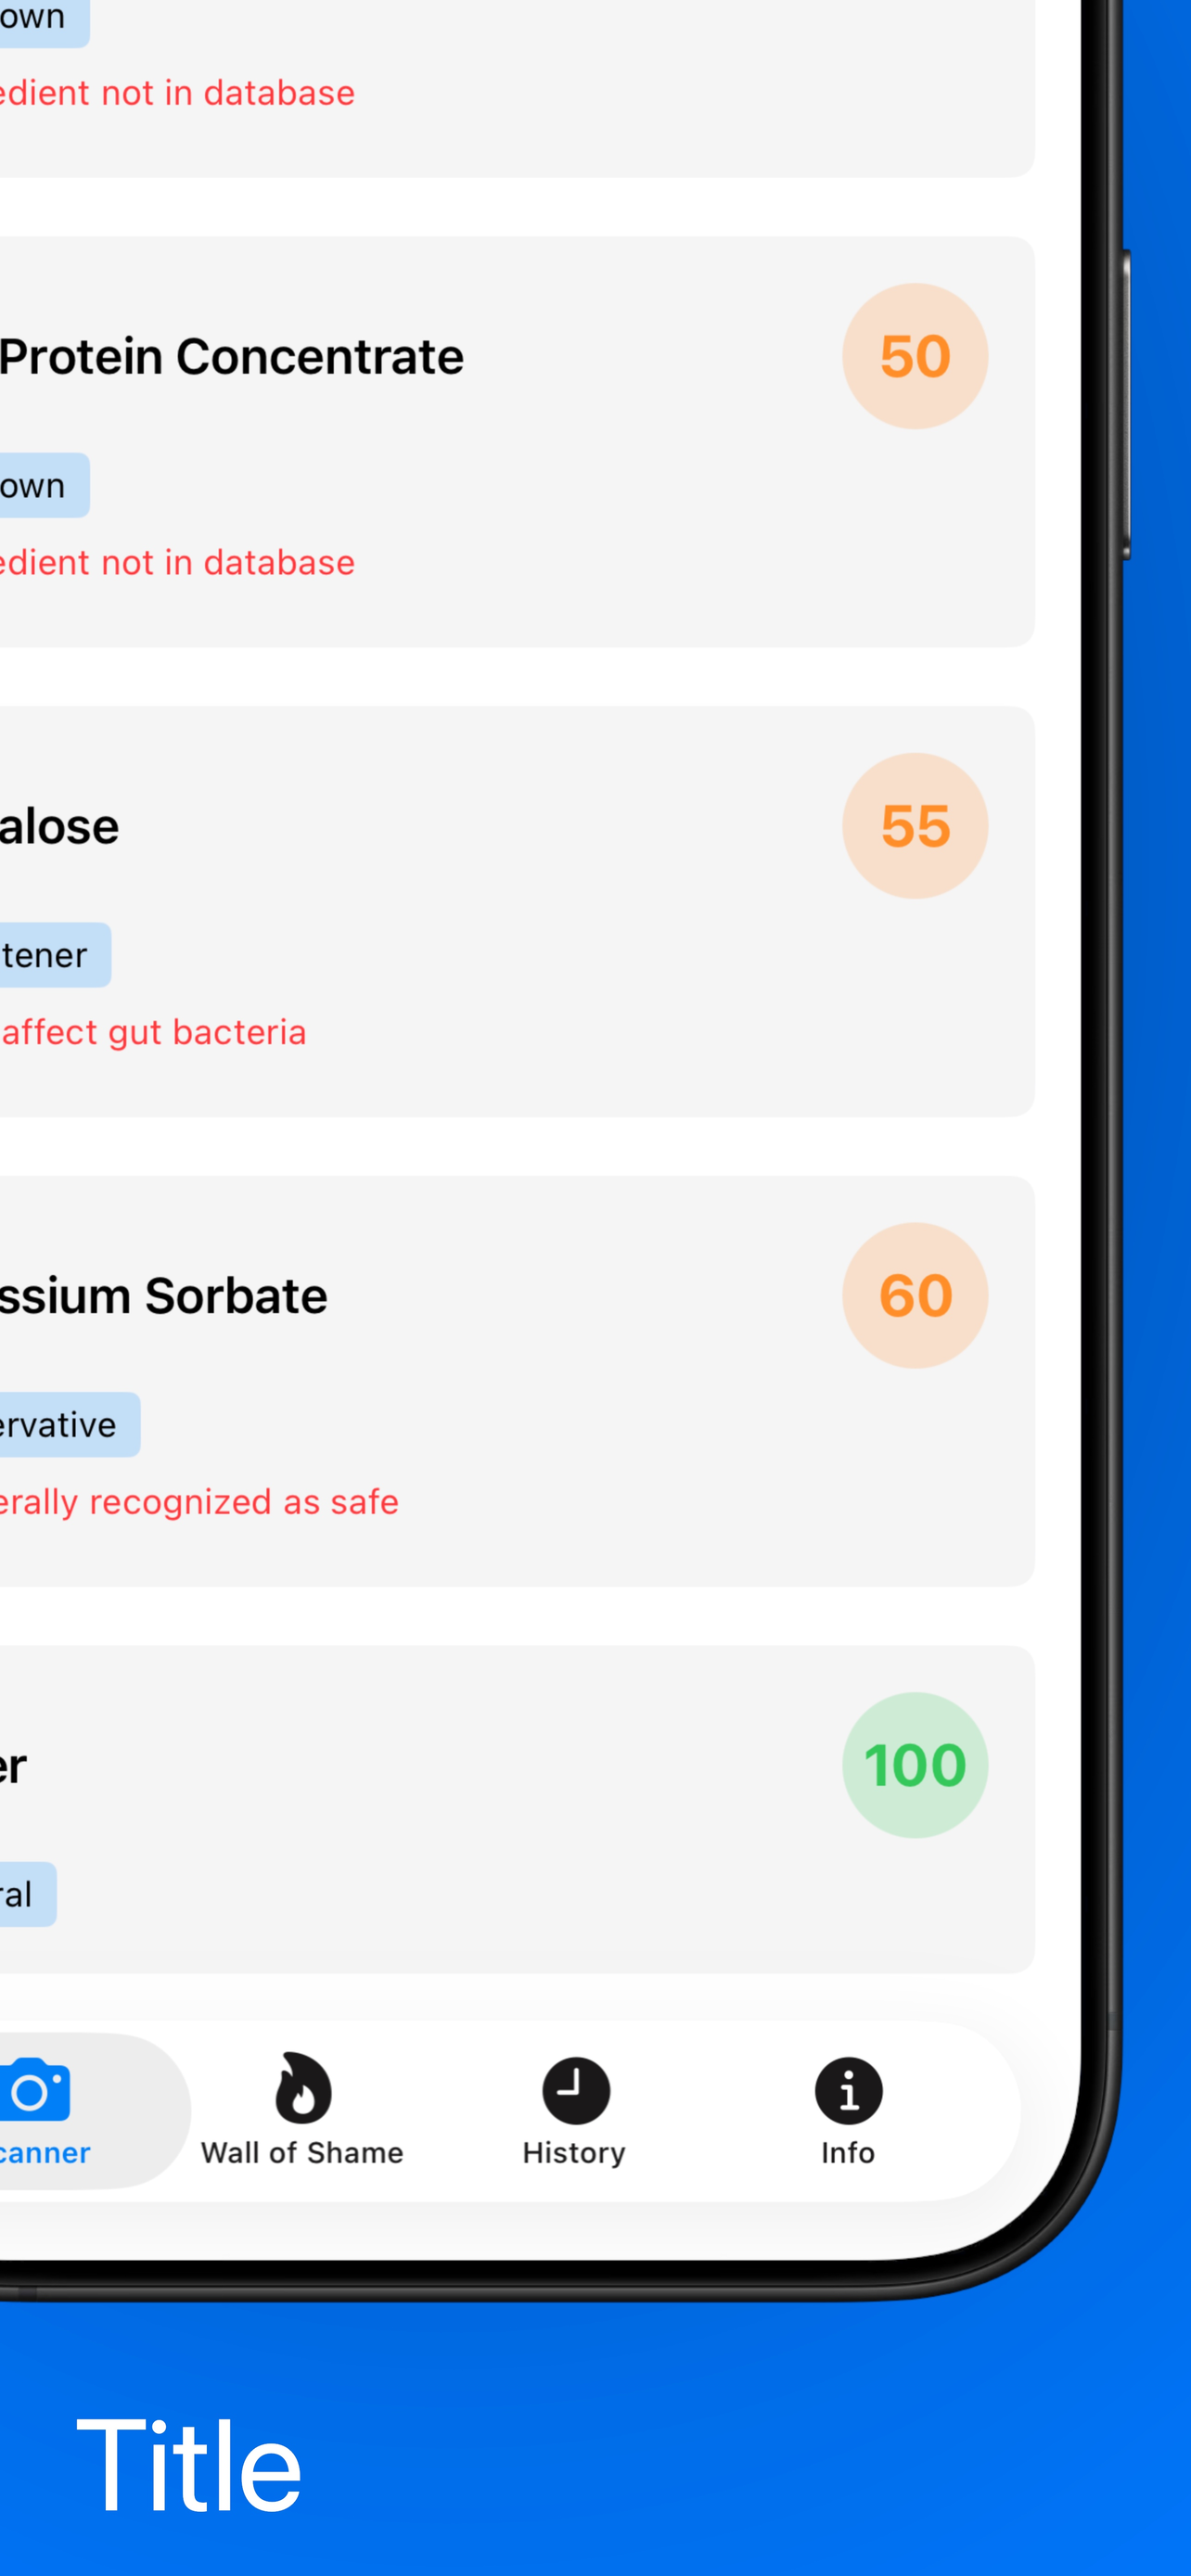
NoJunk sends your photo to our backend which uses AI vision to read the label, split it into individual ingredients, categorize each one (preservative, colorant, sweetener, emulsifier, flavor enhancer, natural), and write a short verdict explaining what's worth noting. Analysis draws on published research from the FDA, WHO, IARC, EFSA and the EWG Food Scores methodology.
The ingredient photo is sent to our backend for analysis, then discarded. Nothing is kept server-side. Your scan history, product photos, and health goals all live in SwiftData on your iPhone — not in a cloud profile. No account is required, so there's nothing to leak.
Yes. During onboarding (or later in settings) you pick from ten health goals: low gluten, reduce sugar, low fat, high protein, low sodium, dairy free, clean energy, healthy fats, no artificial colors, no preservatives. Your chosen goals adjust every future score — gluten-containing ingredients get penalized if you flagged low gluten, protein-rich ingredients get a boost if you picked high protein, and so on.
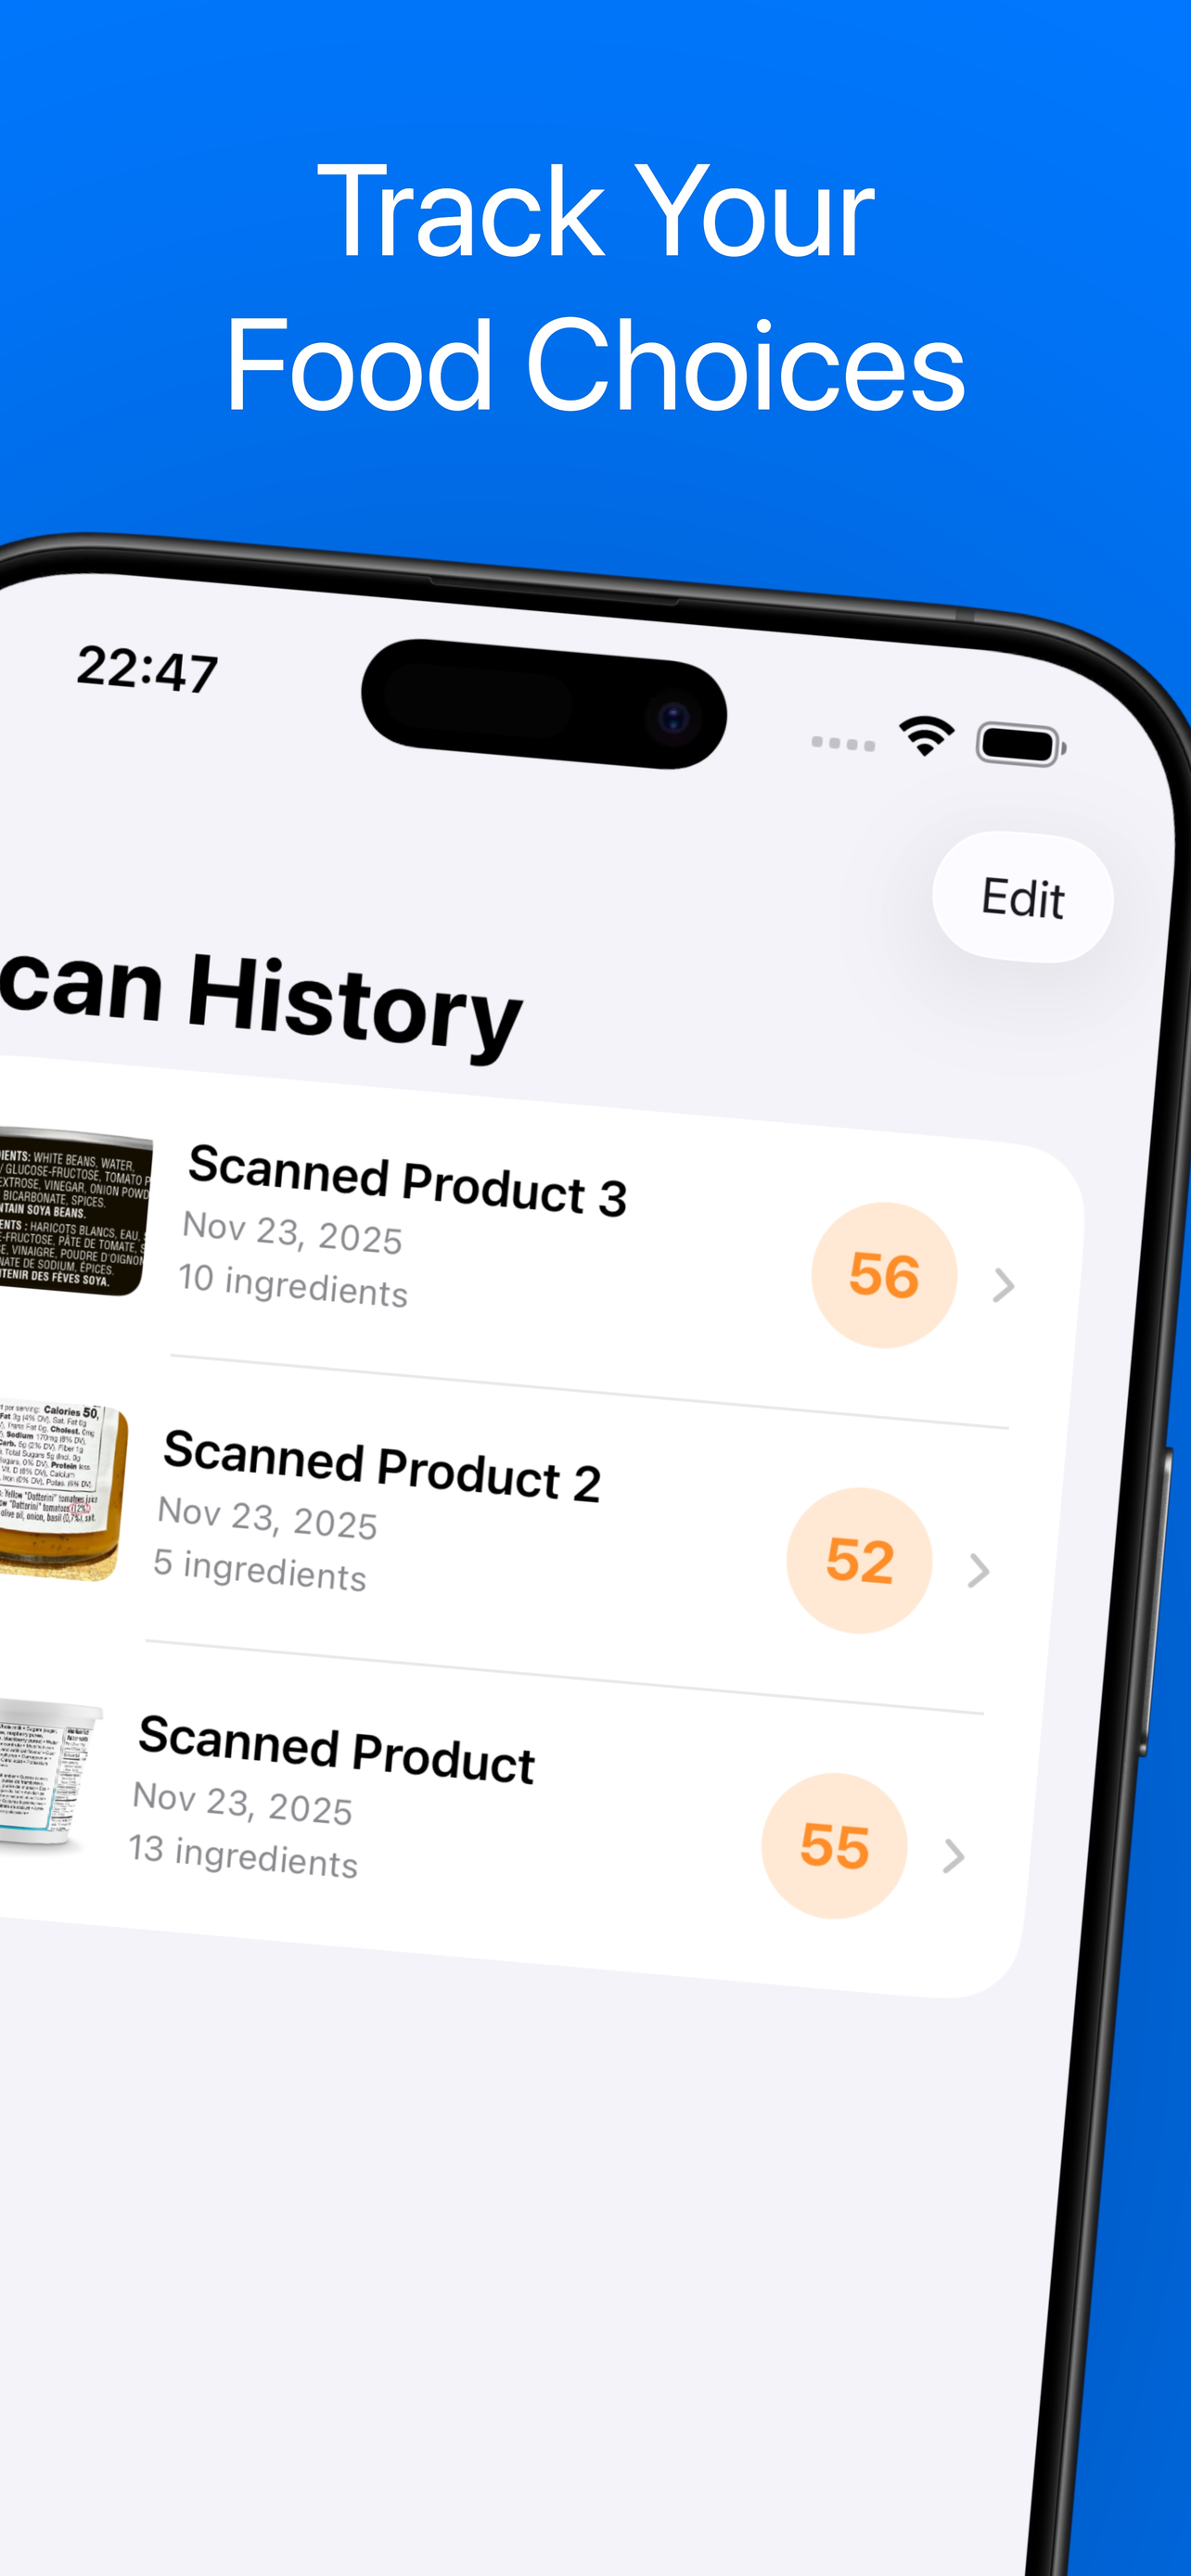
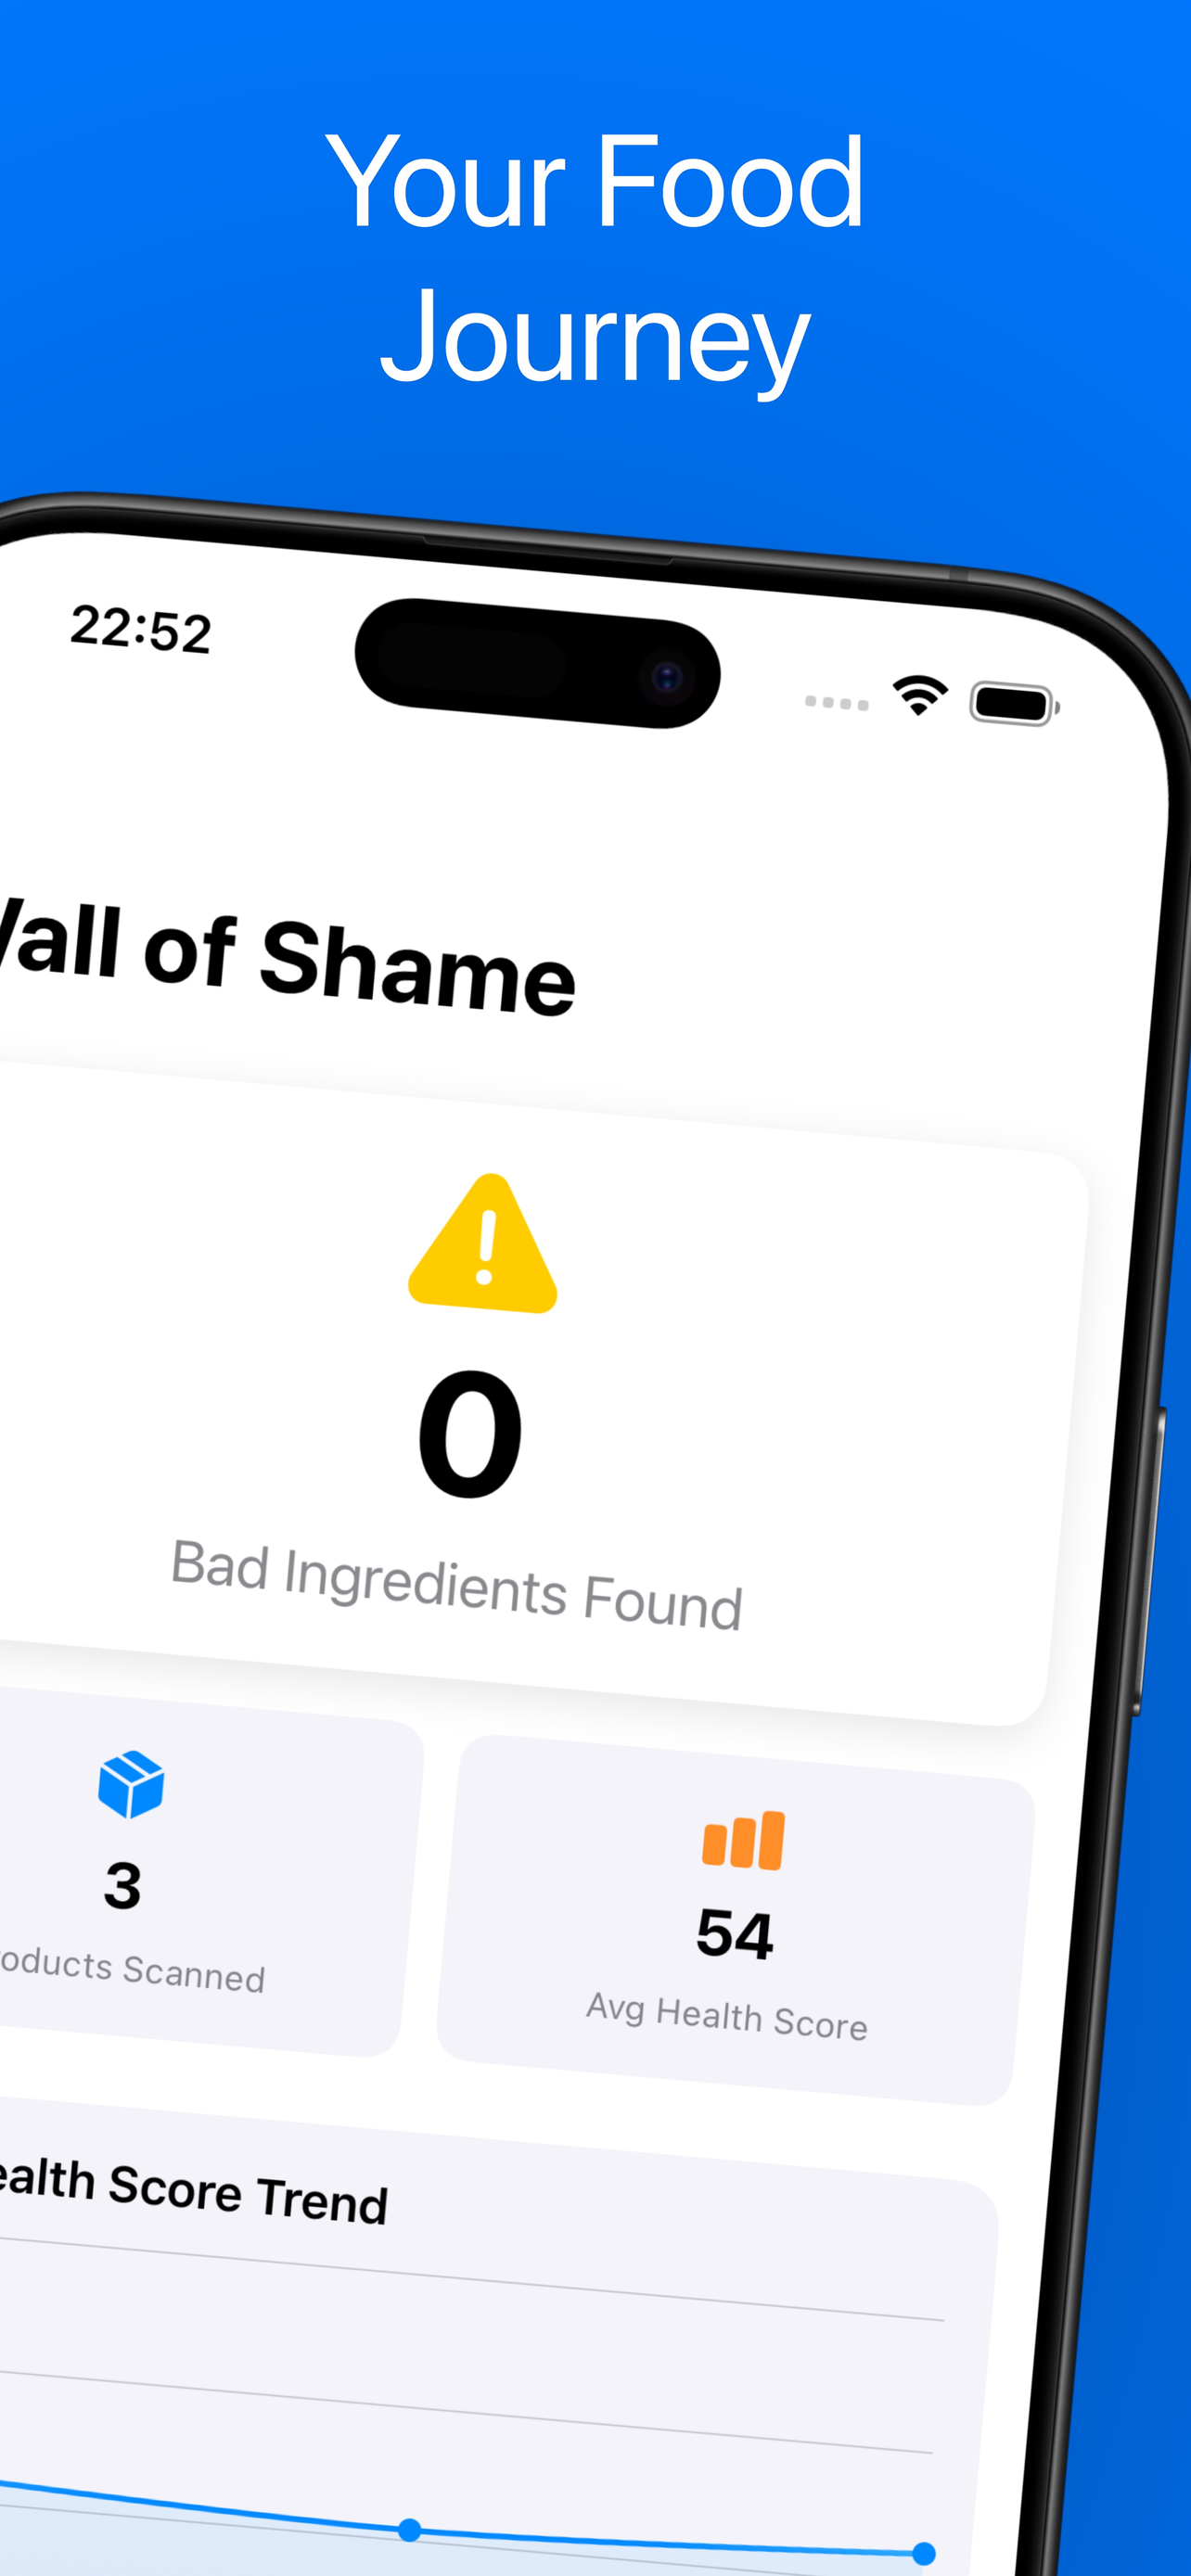
The second tab in the app. It's a dashboard that tracks every scan in your history: your top offending ingredients (the bad stuff that keeps showing up in what you buy), your health score trend line over recent scans, a category breakdown (preservatives vs sweeteners vs natural), and a count of red-flagged ingredients. It's a running scoreboard for your grocery habits.
NoJunk doesn't care whether an ingredient is labeled by its name or an E-number — our AI handles both. E102 and "Tartrazine" both get flagged as an artificial colorant with the same score. We also publish a full E-number guide if you want to learn what each code means.
iOS 17 or later. Runs on iPhone, iPad, Mac with Apple Silicon, and Apple Vision Pro. Optimized for iPhone since that's where you'll actually be holding it in the grocery aisle.
Yuka is a barcode scanner backed by a product database. NoJunk is a label reader backed by AI. Yuka is faster if the product is in its database; NoJunk works on literally any product with a visible ingredient list, including store brands, local products, and whatever you found at an obscure grocery store. NoJunk also does per-ingredient scores, the AI verdict, and personalized scoring via health goals. Full comparison.